

Sample S&P 500 Daily Perspective with Notes
To help you get better acquainted with the GDR Daily Perspective quicker I’m providing below a sample report with notes that should be helpful to both beginner and advanced traders and investors. I hope it’s helpful.
S&P 500 Daily Perspective for Mon 13 Jan 2025
GDR Model Performance
Please see the Performance page for more detailed performance numbers, how they’re calculated and a chart.
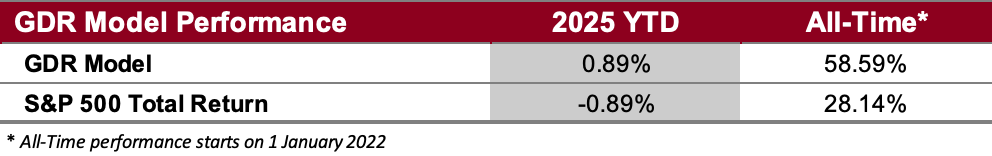
How to Read: the Yearly Performance section provides an update on year-to-date and all-time performance (non-annualized) for both the GDR Model and the S&P 500 Total Return Index as of the close of the previous business day.
GDR Model Outlook
The GDR Model is mostly bearish. The recent indecision in the market seems to be dissipating and it looks to be strongly leaning bearish at this point.
Fundamentals Outlook (as of 17 Jun 2024): for the first time in a while the model is showing stocks as being richly valued (i.e. overpriced). Note that this is just a barometer to help guide longer-term decision-making rather than short-term market timing.
Long-Term Outlook (as of 10 Jan 2025): after recovering a bit last week, the market closed weak again this week. The Long-Term Outlook has been downgraded to neutral and If this weakness is sustained, the odds of a significant sell-off will increase significantly.
---<The content below is only available to Premium Subscribers>---
Short-Term Outlook (as of 10 Jan 2025): the market showed weakness in the short-term consistently throughout this week. The inflation data coming out next week (Tuesday, Wednesday) will be moments to pay attention to; if the market is truly weak, those releases are likely to be followed by strong liquidations.
Breadth Outlook (as of 10 Jan 2025): breadth continues to be bearish, which is additional evidence of weakness in the market.
Volatility Outlook (as of 10 Jan 2025): the Volatility Outlook came within a hair’s breadth of a downgrade on Friday. A volatile outlook implies that the market can experience significant drops (as well as short-covering rallies) in short timespans.

How to Read: the GDR Model Insights is meant to provide a detailed look into the GDR Model’s way of viewing the market. It contains four pieces of information:
Fundamentals: relates the current S&P 500 price to underlying company and macroeconomic fundamentals. There are three different states that are updated quarterly with a few revisions in between updates:
Cheap: GDR Model sees stronger company and macroeconomic fundamentals than reflected on stock prices
Rich: GDR Model sees weaker company and macroeconomic fundamentals than reflected on stock prices
Fair Value: GDR Model sees company and macroeconomic fundamentals fairly reflected on stock prices
Long-Term Outlook: tells you the GDR Model’s expectations for the S&P 500 index typically on a monthly to quarterly timeframe. There are three different states that are updated quarterly:
Bullish: GDR Model assigns greater probability of higher prices
Bearish: GDR Model assigns greater probability of lower prices
Neutral: GDR Model is potentially transitioning away from the previous state
Short-Term Outlook: tells you the GDR Model’s expectations for the S&P 500 index on a shorter timeframe than above, usually on a weekly basis. There are three different states that are updated daily:
Bullish: GDR Model assigns greater probability of higher prices
Bearish: GDR Model assigns greater probability of lower prices
Neutral: the Short-Term Outlook does not provide an edge
Breadth Outlook: aims to provide you an idea of what may happen next with the S&P 500 based on the recent performance of all NYSE and NASDAQ traded stocks. There are three different states that are updated daily:
Bullish: breadth is supportive of higher prices
Bearish: breadth data suggests lower prices to come
Neutral: breadth does not provide an edge
Volatility Outlook: provides an idea of what volatility may be in the market over the next day or two. There are four different states that are updated daily:
Calm: expect calm markets with tight ranges
Stable: suggests stable markets with the occasional shakeout or volatile day
Shaky: the market may have relatively wide ranges
Volatile: expect volatile markets and wide ranges
Note that Volatility Outlook only provides an expectation for volatility, but not for directionality.
GDR Model Position
The GDR Model closed its short position and opened a very modest long. Given the current context, this does not at all suggest that the model expects the market to strengthen next week. Rather it just means that the odds of a sustained sell-off at the start of next week are relatively low. If the model expected strength in the market then it would go long at a much bigger size.
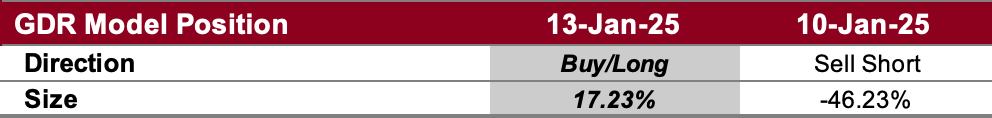
How to Read: the GDR Model Position section tells you exactly how the GDR Model is positioned going into the trading day. It’s broken into two parts.
Position Direction: this states the GDR Model’s position direction which can be Buy/Long, Sell Short, or Flat/Cash
Position Size: this describes GDR Model’s position size going into the day. This is expressed in percentage of the portfolio’s market value which you could reference to replicate the position in your own portfolio. As an example, if GDR Model is 50% in the Buy/Long Direction and you want to mimic the position in your $100,000 portfolio, then you would buy $50,000 worth of the S&P 500 via futures, or an ETF that tracks the index closely